Posts Tagged ‘USA’
January 23rd, 2025

The United States boasts a diverse array of cities, each offering unique advantages for entrepreneurs. The country has a very dynamic business scene and ranks 6th among all OECD high-income countries for ease of doing business.
The United States is also the world’s biggest economy, with more than 33 million businesses, which confirms its standing as one of the most favorable environments for starting a business.
In addition to a vast consumer market, high rates of pay, abundant resources, and a culture that encourages innovation and entrepreneurship, the nation offers numerous opportunities for new ventures. However, choosing the right city to launch a new business is crucial to leveraging these benefits effectively.
This article explores the top 10 cities to start a business in the USA, highlighting what makes each location exceptional for entrepreneurs.
Read the rest of this entry »
Tags: Arizona, Best US Cities for Business, Business Advice, Business Start Ups, Florida, Georgia, North Carolina, statistics, Tennessee, Texas, USA, USA Cities
Posted in Atlanta, Best Cities for Business in the USA, Business Advice, Business Districts, Business Start Ups, Cities & States, Entrepreneurs, Florida, Georgia, Market Overviews, Miami, North Carolina, Texas, Trends and Statistics | No Comments »
Add to: Del.icio.us | Digg
June 5th, 2024

All over the United States, central business districts serve as a magnet for economic growth and employment. In this article, we offer an updated overview of the top 10 largest CBDs in the country, accounting for the changes that CBDs have experienced post-2020.
1. New York City
New York City’s CBD is the largest in the country and covers a large area in Midtown and downtown Manhattan.
The city’s CBD contains nearly 420 million square feet of office real estate, with the biggest clusters being in Grand Central, Penn Station, Sixth Avenue, Rockefeller Center, Financial East, and World Trade Center.
Read the rest of this entry »
Tags: Best US Cities for Business, Business Districts, Business Start Ups, CBD's, USA
Posted in Best Cities for Business in the USA, Business Districts, Business Spotlights, CBD's | No Comments »
Add to: Del.icio.us | Digg
February 24th, 2022
 The US office market struggle to get back on its feet for most of 2021, despite the year starting with the expectation that this arm of the commercial real estate market would be on its way to recovery by Q3 to Q4. Ultimately, the emergence of the Delta and Omicron variants of COVID-19 resulted in forecasts being revised, and the recovery horizon was pushed to 2022.
We’ve collected a brief overview of the trends, figures, and projections for the 2022 US office space market below, check back frequently in the year ahead for more insight into industry trends and recovery projections.
Economic Indicators Tipped to Improve
There are many factors influencing office market performance, but macro-economic indicators are some of the most critical. As we settle into 2022, a decline in unemployment is expected to be one of the most important factors underscoring the recovery of the office market. Recent data from the U.S. Bureau of Labor Statistics outlined a small uptick in unemployment in January 2022, moving from 3.9% at the end of 2021 to 4.0% to end the first month of the new year. Read the rest of this entry »
Tags: Commercial Real Estate, Office Market Trends, Office Rental, Office Space, Office Space Trends and Forecasts, Office Talk, USA
Posted in Office Space Forecasts and Trends, Office Talk, Trends and Statistics, Uncategorized | No Comments »
Add to: Del.icio.us | Digg
February 11th, 2022

Notable Office Market Insights
- Ongoing recovery is the main theme, continuing the trend seen in most office markets throughout 2021.
- Positive absorption indicators.
- Slight increase in rental rates.
- Marked differences in occupancy levels, vacancy rates and general performance from city to city.
- Remote working practices are still commonplace in key markets, such as San Francisco.
- 142 million square feet of office space currently under construction.
Lease Rates & Asking Rents
Recent data from Commercial Edge outlines a nationwide rental listing rate average of $38sq/ft in January 2022. These figures may be seen as somewhat inflated due to the number of high quality spaces currently listed due to being vacant, with Class A workspaces being listed at much higher prices.
According to Avison Young, Q4 average rental prices per square foot in gateway markets were as follows:
Read the rest of this entry »
Tags: Boston, chicago, Commercial Real Estate, Dallas, dc, Florida, Houston, Los Angeles, Manhattan, new york, office market report, Office Market Trends, Office Space, Office Talk, San Francisco, Texas, USA
Posted in National Market Reports, Office Space Forecasts and Trends, Office Talk, Real Estate, Trends and Statistics | No Comments »
Add to: Del.icio.us | Digg
February 24th, 2017
 The following is the second in our series focusing on providing information on the various types of office space available, from business parks to hot desking, conventional office accommodation to shared coworking options.
What is a startup?
Before discussing the qualities of a startup space or incubator, it is worth determining exactly what a startup is.
Theoretically, any new business whose market is not defined by location could be considered a startup. (For example, a newly opened restaurant is indeed a small business, but, because the market is location based, it is not a startup.)
In terms of use in today’s economy, a startup is a small business, usually technology oriented; startups generally provide service to a worldwide market. Tech startups are not confined by location or operating hours only by how many consumers or clients they can reach.
Incubators
In the non business world, an incubator is a warm safe place for a baby or a baby chick to get a nice healthy start to life. In the business world, an incubator is much the same. Incubators provide services that help startups get through those trials faced by new businesses.
Services
Some of the services provided by incubators are:
- Legal: things like proprietary guidelines, creating bylaws or business plans, and navigating the regulations of your industry.
- Business management: basic accounting services, business organization tips, company setup, and help with building and framing the identity of your startup.
- Marketing: market research and networking.
- Funding: access to angel investors or venture capitalists and help in locating other sources of funding for your startup.
- Networking: introduction to others in your industry, networking with mentors, investors, and industry specialists.
- Site services: an office or team workspace, access to high-speed internet, copying and faxing, and other clerical or administrative services. Read the rest of this entry »
Tags: business incubators, Office Rental, office space options, startups, USA
Posted in Business Advice, Business Start Ups, Office Space Options Series | No Comments »
Add to: Del.icio.us | Digg
February 2nd, 2017
 Overview of USA Office Market
During 2016, the USA office market was marked by a climate of cautious optimism and moderate growth across the board. This was mostly evident in office rental rates, which increased by a modest 0.1 per cent or even declined in cities like Chicago, New York, Washington and San Francisco. This was coupled with a slow-down in leasing activity, as net absorption rates only reached 6.5 million square feet during the last quarter of 2016. The bulk of lease transactions consisted of small and medium-sized office properties, and the total number of leases exceeding 500,000 dropped by 43 per cent.
Key market indicators (such as take-up, vacancy, and availability rates) were linked to the performance of those industry sectors that make up for the bulk of office occupiers in the USA. 2016 saw a tightening of the labor market in the tech sector, driving vacancy rates down to break the 10 per cent barrier for the first time. This offset the relative stagnation in activity coming from occupiers involved in financial services, legal, and government.
Important figures that reveal the market’s performance during 2016 included:
– A total inventory in excess of 137 million square feet
– Total vacancy rates of 16.9 per cent
– Annual net absorption above 1.1 million square feet
– Nationwide average asking rates $23.91
– Office space under construction 4.9 million square feet, of which 53.7 per cent is already pre-leased
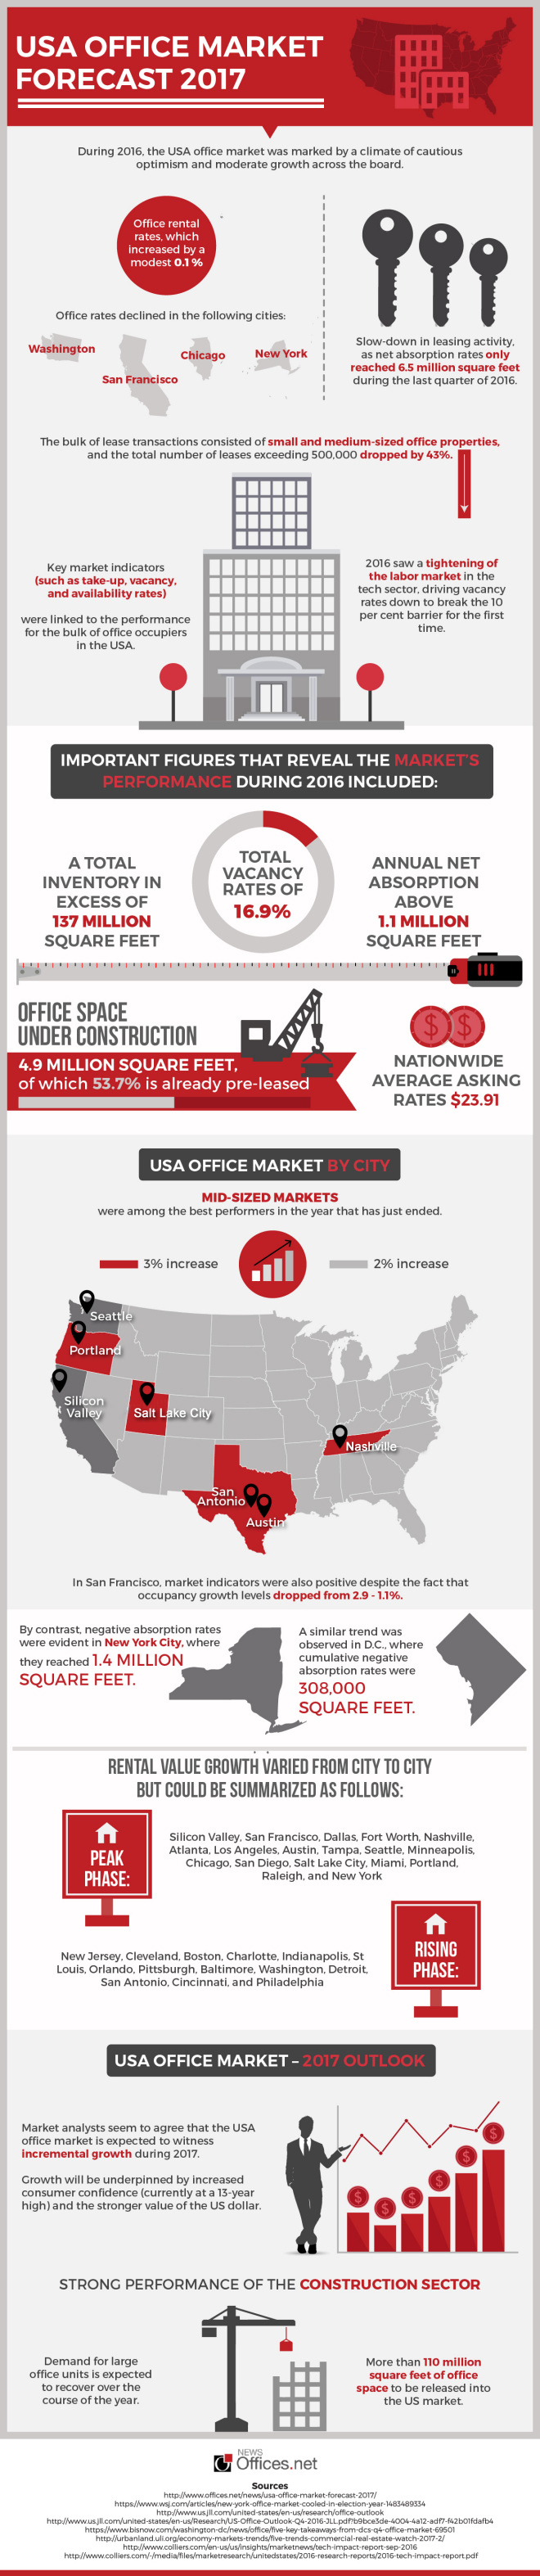
USA Office Market by City
Mid-sized markets were among the best performers in the year that has just ended. Portland, Nashville, Salt Lake City, and San Antonio were characterized by occupancy increases that averaged 3 per cent. In San Francisco, market indicators were also positive despite the fact that occupancy growth levels dropped from 2.9 to 1.1 per cent. Other regional office markets that did well included Austin, Silicon Valley, and Seattle. In these markets, occupancy growth averaged 2 per cent. Read the rest of this entry »
Tags: 2017, Business Start Ups, Office Market Statistics, Office Market Trends, Office Rental, Office Space, Office Space Trends and Forecasts, USA
Posted in Best Cities for Business in the USA, Office Space Forecasts and Trends | No Comments »
Add to: Del.icio.us | Digg
January 9th, 2017
The following is the first in our series focusing on providing information on the various types of office space available, from business parks to hot desking, conventional office accommodation to shared coworking options.
Business centers and business parks are locations with several businesses grouped together, like a shopping center, but for commercial and office based businesses. The typical business park is a development of land and buildings set aside exclusively for the use of offices of all sizes and designs.
Business Parks in the Suburbs
Business parks are found in cities, but are more frequently located in suburban areas. Developers build a variety of sizes and designs of office spaces in one location. Available spaces will vary from a single occupancy 400 square foot office space to a 50,000 square foot warehouse space, all on one site. Occasionally, within the business park, you’ll find a larger building with several offices these are frequently owned or managed by a single entity. Owners of the larger building typically rent the spaces to small businesses as conventional, serviced, or virtual offices.
A business park is in stark contrast with the big city high rise type business locations. Business parks are often designed to resemble a university campus or suburban neighborhood. There are one or two story buildings, instead of twenty story skyscrapers; there are green spaces; there may be fountains or park benches in the surrounding areas. These business parks are ideal locations for service or retail based businesses that need a location for customers to visit.
Some business parks become so large and welcoming to businesses that they begin to resemble a small town. As the success of businesses located at a specific park grows, more and more businesses choose to locate there. From that point it may seem inevitable that neighborhoods and communities begin to sprout up in the area.
The Appeal of Business Parks
For many companies, cost effectiveness proves to be the drawing feature to a business park space. The spaces are usually more affordable than commercial or retail spaces in other locations. Often a group of similarly based businesses, such as medical specialists, will locate in a business park creating a network of services that appeal to consumers.
Typically, the companies located in a business park will be diverse, varying from service based industries, such as computer repair, for example, to investment firms that are closed to the public. The diversity of the business park is limited only by the amenities offered by the developers. Business parks can help create a concentrated, affordable non-industrial office district and contribute to the communities in which they are constructed.
For information on business centre and office accommodation opportunities across the US click here.
Tags: business centres, business parks, Office Rental, Office Space, USA
Posted in Business Districts, Office Space Options Series | No Comments »
Add to: Del.icio.us | Digg
February 24th, 2016
 Bolstered by a robust economic performance, the office market in Washington DC delivered a fine performance throughout 2015. Unemployment levels in the DC metropolitan area were at their lowest since 2008, reaching figures well below the US national average (4.3 per cent vs 5 per cent). These conditions have helped shape a real estate market that is predominantly favourable to landlords, as the following trends demonstrate:
Rental values continued their slow recovery throughout 2015 and are currently set around the $50 / square foot mark.
Availability rates for all types of office space went down to 16.3 per cent. Towards the end of 2015, approximately 13.2 million square feet of office space were vacant.
The most significant transactions involved lease renewals or re-lets, although there have been several large sale transactions taking place in the city’s East End too.
Annual absorption levels were high at 887,000 square feet, and construction activity increased by 22 per cent on a year-on-year basis.
However, here has modest decrease in vacancy rates, especially as far as Class A space is concerned. Vacancy rates for these types of office properties still remain relatively high at 11.5 per cent. Vacancy levels for Class B and Class C space in Washington were slightly lower at 10 per cent.
Washington DC Office Market: 2015 Key Facts & Figures
During 2015, vacancy rates for all types of office space in Washington went down to 10.5 per cent, pretty much in line with the city’s historical average of 10.7 per cent. At the same time, net absorption levels increased by a staggering 185 per cent, going from 198,000 square feet in 2014 to 398,000 by December 2015. Nearly half of the transactions involved office stock in Washington’s CBD, which clearly outperformed all other sub-markets. This is attributed to the ongoing influx of new tenants relocating from secondary office locations into the CBD. This trend began to be evident in 2014 and has been solidified over the past 12 months. Read the rest of this entry »
Tags: 2016, dc, Office Market Statistics, Office Space Trends and Forecasts, USA, Washington
Posted in DC, Office Space Forecasts and Trends, Trends and Statistics, Washington | No Comments »
Add to: Del.icio.us | Digg
October 6th, 2015
 Centered on the north-central region of the country, the Midwest United States includes 12 states including Illinois, Indiana, Iowa, Kansas, Michigan, Minnesota, Missouri, Nebraska, North Dakota, Ohio, South Dakota and Wisconsin. Although major urban centers such as Chicago are known around the world as key economic drivers, the Midwest is also home to several smaller cities that provide promising conditions for new businesses. WalletHub’s 2015 ranking of the best cities to start of a business in the United States included six Midwestern cities in the top 20. The ranking used a number of metrics, from the five-year survival rate of businesses to the affordability of office space.
Springfield, Missouri
Springfield, Missouri ranked as the best Midwestern city to start of business in the United States, according to the 2015 study. The city also placed first nationally in terms of access to resources, including financing and affordable office space. Known as the Queen City of the Ozarks and the Birthplace of Route 66, Springfield is home to the Missouri State University and Drury University. The third largest city in Missouri is the economic hub of an area that spans 27 counties in Missouri and neighboring Arkansas and is home to some 1 million people. The economy is based on health care, manufacturing, retail, education and tourism. The city has also been recognized for its high quality of life, and in 2008 it was among the best communities for young people by the America’s Promise Alliance and relocating families by Worldwide ERC.
Sioux Falls, South Dakota
The same ranking found that Sioux Falls was the sixth best city to start a business in the US. With a growing population, the city also ranked second in terms of the best business environment in the United States. It was also named as the next big boom town by The Atlantic in 2013. The largest city in South Dakota, Sioux Falls is a diverse economic center focused on financial services, health care and retail. Sitting on the crossroads of interstates 90 and 29, the city is within a day’s drive from many major cities in the Midwest. The lack of a state corporate tax has helped attract a number of financial companies to Sioux Falls, including Wells Fargo and Citigroup. Read the rest of this entry »
Tags: 2015, Best US Cities for Business, Business Start Ups, Columbus, Fort Wayne, Kansas, Missouri, Ohio, Sioux Falls, South Dakota, Springfield, USA
Posted in Best Cities for Business in the USA, Business Spotlights, Cities & States, Trends and Statistics | No Comments »
Add to: Del.icio.us | Digg
March 14th, 2012
From the 30th of April, 2012, most employers in the US private sector will be required to display posters stating the rights of workers to form a union. The National Labor Relations Board (NLRB) rule states that under federal regulation, an 11 by 17 inch poster must be displayed in a prominent position, informing each employee of their rights to engage in collective bargaining and form a union. This regulation will apply to both non union and union workplaces.
The NLRB Employee-Rights posting rule has gathered some controversy and has been challenged by a number organisations including the National Federation of Independent Business (NFIB) and the National Association of Manufacturers (NAM). The National Federation of Independent Business (NFIB) and the National Association of Manufacturers (NAM) argued that the National Labor Relations Board’s Employee-Rights notice posting regulation is in violation of an employers First Amendment rights, and the organisations filed a complaint in the US District Court. Judge Amy Berman Jackson, the US District Court Judge for the District of Columbia, rejected the argument and upheld the National Labor Relations Board’s Employee Rights posting requirement rule.
Government owned corporations including the U.S. Postal Service and the Federal Reserve System are exempt from the NLRB Employee Rights posting rule. In addition stock brokerage firms, airline and agricultural employers and professional sports teams are also exempt from the ruling.
The National Labor Relations Board is an independent five member federal agency which has been authorized by the US Government to protect employee rights, ensure employer and union rights and obligations are upheld and promote jurisdictional standards. The NLRB conducts elections, investigates charges, decides cases, facilitates settlements and enforces orders. The current National Labor Relations Board memebers are Mark G. Pearce (Chairman), Sharon Block, Richard Griffin, Brian Hayes and Terence F.Flynn. The President of the United States, with the consent of the Senate, appoints the board members for a five year term.
References for this article: The National Labor Relations Board and JDSUPRA
Tags: Brian Hayes, Employee Rights, Federal Reserve System, Judge Amy Berman Jackson, Mark G. Pearce, NAM, National Association of Manufacturers, National Federation of Independent Business, National Labor Relations Board, NFIB, NLRB, Richard Griffin, Sharon Block, Terence F.Flynn, U.S. Postal Service, US-Regulations, USA, USA-Employee-Rights
Posted in Business Advice, Cities & States, Employee Rights, Employment Regulations | No Comments »
Add to: Del.icio.us | Digg