Posts Tagged ‘Office Space Trends and Forecasts’

United States Commercial Property Prices Per Square Foot

February 28th, 2023

Smiling office colleagues conduct a meeting discussing United States commercial property prices per square foot. Three people are seated with their laptops open in front of them on the meeting room table while one woman in a grey top stands at the head of the table addressing her gathered colleagues - Offices.net.

The United States is home to one of the world’s largest commercial real estate markets, with an estimated revenue worth of approximately $1.2tr. In terms of size, industrial space is the largest sub-market with 21.7bn square feet, followed by retail with 14bn, and offices, which account for 11.8bn.

In Q1 2023, the average price per square foot for US offices was just over $38. Retail averaged out to $18.09 / square foot, and industrial space came in at just under $8 / square foot. However, there are significant variations in average prices based on location and real estate class. Here is a summary of average commercial rates in key USA cities:

  •   New York: Average gross rates for metro New York offices are $77 / sq ft / year. Industrial space averages $19 / sq ft / year.
  •   Los Angeles: $44 / sq ft / year for offices in the metropolitan area and $11 / sq ft / year for industrial premises.
  •   Miami: In the same range as Los Angeles, at $46 / sq ft / year for offices and slightly lower for industrial space ($8 / sq ft / year).
  •   Boston: $38/ sq ft / year for metro offices, rising to $80 in Cambridge. Industrial properties average $10 / sq ft / year.
  •   Philadelphia: $32 / sq ft / year for city center offices, $27 for suburban space, and $6 / sq ft / year for industrial properties.
  •   Atlanta: Slightly under $30 / sq ft / year for offices with a rate of $35 in Downtown Atlanta. Industrial space is charged at an average of $5 / sq ft / year.
  •   Chicago: Approximately $33 / sq ft / year for office space, rising to averages above $40 in The Loop. Industrial premises average $6 / sq ft / year.
  •   Dallas and other urban centers in Texas: between $25 and $30 / sq ft / year, whereas industrial rates are below $5.

Read the rest of this entry »

US Office Market Trends 2022 – Statistics, Challenges and Outlook

February 24th, 2022

man looks over u.s. office market trends 2022 report at offices.netThe US office market struggle to get back on its feet for most of 2021, despite the year starting with the expectation that this arm of the commercial real estate market would be on its way to recovery by Q3 to Q4. Ultimately, the emergence of the Delta and Omicron variants of COVID-19 resulted in forecasts being revised, and the recovery horizon was pushed to 2022.

We’ve collected a brief overview of the trends, figures, and projections for the 2022 US office space market below, check back frequently in the year ahead for more insight into industry trends and recovery projections.

Economic Indicators Tipped to Improve

There are many factors influencing office market performance, but macro-economic indicators are some of the most critical. As we settle into 2022, a decline in unemployment is expected to be one of the most important factors underscoring the recovery of the office market. Recent data from the U.S. Bureau of Labor Statistics outlined a small uptick in unemployment in January 2022, moving from 3.9% at the end of 2021 to 4.0% to end the first month of the new year. Read the rest of this entry »

Office Features to Look Out for in the Second Half of 2021

June 23rd, 2021

The US office market has been dramatically transformed by the changes to work practices and mobility restrictions implemented throughout the course of 2020 and early 2021. Whilst it was predicted that the market would slowly rebound starting in recent months, the demands of office occupiers will have changed substantially since the start of the COVID-19 pandemic. Below is a brief overview of the main things to look for in an office space during the second half of 2021.

Office Layout

Flexible spaces

Flexibility remains a key consideration when choosing an office, not only in terms of lease terms, but also office layouts. Many office-based companies are still unsure about their ability to retain staff in the face of reduced revenue, combating this uncertainty by implementing rotating shifts or flexible work hours, two factors which have ultimately led to businesses struggling to identify the total headcount in the office at any given time.

This uncertainty will lead to an increase in demand for modular spaces that can be adjusted depending on the number of people present in the workplace. These kinds of dynamic layouts have been an option for several years, often going hand in hand with trends towards multi-functional office spaces. Some of the main elements that typify flexible workspaces include:

  •  Blurred indoor to outdoor transitions.
  •  Movable walls and room dividers.
  •  Lightweight or mobile office furniture.
  •  Adjustable or movable lighting.

Read the rest of this entry »

United States Office Rental Market – Trends for 2021

January 27th, 2021

Commercial real estate was one of the hardest hit sectors following the coronavirus outbreak in 2020. The pandemic and the measures taken to curb its spread brought significant changes to office-based workplaces, driving a sharp and sudden increase in remote work practices. The most immediate consequence of this shift was a softening in rental activity due to the decreased need for physical office space in the short-term. As a result, 2020 ended with a marked decline in take-up volume and an increase in office vacancy rates across the nation.

The United States office rental market entered the new year in a scenario marked by declining rental rates and compromised fundamentals. As we move further into 2021, these trends are likely to remain in place and some markets may begin to feel the full impact of the economic crisis, whereas others will prove more resilient.

Read the rest of this entry »

United States Commercial Property Prices 2020: Per Square Foot

December 15th, 2020

An updated version of this post can be found by clicking here.

The United States is home to one of the world’s largest commercial real estate markets, with an estimated worth of approximately $950bn. In terms of size, industrial space is the largest sub-market with 21bn square feet, followed by retail with 13bn, and offices, which account for 11bn.

In Q2 2020, the average price per square foot for US offices was just over $35. Retail averaged out to $18.09 / square foot, and industrial space came in at just under $8 / square foot. However, there are significant variations in average prices based on location and real estate class. Here is a summary of average commercial rates in key USA cities:

  •   New York: Average gross rates for metro New York offices are $81 / sq ft / year. Industrial space averages $19 / sq ft / year.
  •   Los Angeles: $44 / sq ft / year for offices in the metropolitan area and $11 / sq ft / year for industrial premises.
  •   Miami: In the same range as Los Angeles for CBD offices and slightly lower for industrial space ($8 / sq ft / year).
  •   Boston: $39/ sq ft / year for metro offices, rising to $80 in Cambridge. Industrial properties average $10 / sq ft / year.
  •   Philadelphia: $36 / sq ft / year for city center offices, $27 for suburban space, and $6 / sq ft / year for industrial properties.
  •   Atlanta: Slightly under $30 / sq ft / year for offices with a rate of $35 in Downtown Atlanta. Industrial space is charged at an average of $5 / sq ft / year.
  •   Chicago: Approximately $33 / sq ft / year for office space, rising to averages above $40 in The Loop. Industrial premises average $6 / sq ft / year.
  •   Dallas and other urban centers in Texas: between $25 and $30 / sq ft / year, whereas industrial rates are below $5.

Read the rest of this entry »

How Shrinking Office Spaces In New York City Mean Less Privacy For Employees

June 25th, 2019

People on laptops in an open plan workspaceNew York City is home to more than 500 million square feet of office space, which make it one of the world’s largest office markets. While that seems a large amount, space shortages are a reality, and not only in terms of the offices available. Rising rental values mean that many New York companies are choosing to downsize or to make changes to their office layout to maximize space and cut costs. Nowadays, it is not uncommon for companies to move to office premises that are up to 25 percent smaller, yet the amount of people sharing that space remains the same.

Another way in which the amount of office space allocated to each staff member is getting scarcer is because of current trends towards open plan offices and collaborative spaces. The concept of the sharing economy has extended into office design and space allocation, with shared workspaces becoming increasingly more common, which means individual desks are being replaced by large long tables. In fact, New York leads the nation’s provision of shared office space, and even in traditional offices there have been changes in the desk space – meeting or collaborative space ratio, with the balance switching towards the latter.

Read the rest of this entry »

USA Office Market Forecast 2017

February 2nd, 2017

USA Office Buildings offices.net
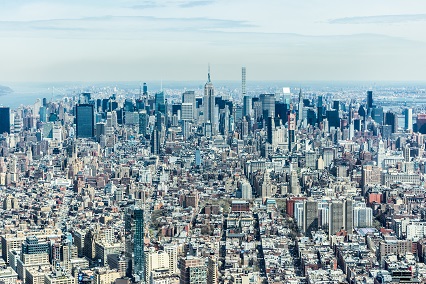
Overview of USA Office Market

During 2016, the USA office market was marked by a climate of cautious optimism and moderate growth across the board. This was mostly evident in office rental rates, which increased by a modest 0.1 per cent or even declined in cities like Chicago, New York, Washington and San Francisco. This was coupled with a slow-down in leasing activity, as net absorption rates only reached 6.5 million square feet during the last quarter of 2016. The bulk of lease transactions consisted of small and medium-sized office properties, and the total number of leases exceeding 500,000 dropped by 43 per cent.

Key market indicators (such as take-up, vacancy, and availability rates) were linked to the performance of those industry sectors that make up for the bulk of office occupiers in the USA. 2016 saw a tightening of the labor market in the tech sector, driving vacancy rates down to break the 10 per cent barrier for the first time. This offset the relative stagnation in activity coming from occupiers involved in financial services, legal, and government.

Important figures that reveal the market’s performance during 2016 included:

– A total inventory in excess of 137 million square feet

– Total vacancy rates of 16.9 per cent

– Annual net absorption above 1.1 million square feet

– Nationwide average asking rates $23.91

– Office space under construction 4.9 million square feet, of which 53.7 per cent is already pre-leased

USA Office Market Forecast 2017


USA Office Market by City

Mid-sized markets were among the best performers in the year that has just ended. Portland, Nashville, Salt Lake City, and San Antonio were characterized by occupancy increases that averaged 3 per cent. In San Francisco, market indicators were also positive despite the fact that occupancy growth levels dropped from 2.9 to 1.1 per cent. Other regional office markets that did well included Austin, Silicon Valley, and Seattle. In these markets, occupancy growth averaged 2 per cent. Read the rest of this entry »

Washington DC Office Market: 2016 Forecast

February 24th, 2016

Bolstered by a robust economic performance, the office market in Washington DC delivered a fine performance throughout 2015. Unemployment levels in the DC metropolitan area were at their lowest since 2008, reaching figures well below the US national average (4.3 per cent vs 5 per cent). These conditions have helped shape a real estate market that is predominantly favourable to landlords, as the following trends demonstrate:

  • Rental values continued their slow recovery throughout 2015 and are currently set around the $50 / square foot mark.
  • Availability rates for all types of office space went down to 16.3 per cent. Towards the end of 2015, approximately 13.2 million square feet of office space were vacant.
  • The most significant transactions involved lease renewals or re-lets, although there have been several large sale transactions taking place in the city’s East End too.
  • Annual absorption levels were high at 887,000 square feet, and construction activity increased by 22 per cent on a year-on-year basis.
  • However, here has modest decrease in vacancy rates, especially as far as Class A space is concerned. Vacancy rates for these types of office properties still remain relatively high at 11.5 per cent. Vacancy levels for Class B and Class C space in Washington were slightly lower at 10 per cent.
  • Washington DC Office Market: 2015 Key Facts & Figures

    During 2015, vacancy rates for all types of office space in Washington went down to 10.5 per cent, pretty much in line with the city’s historical average of 10.7 per cent. At the same time, net absorption levels increased by a staggering 185 per cent, going from 198,000 square feet in 2014 to 398,000 by December 2015. Nearly half of the transactions involved office stock in Washington’s CBD, which clearly outperformed all other sub-markets. This is attributed to the ongoing influx of new tenants relocating from secondary office locations into the CBD. This trend began to be evident in 2014 and has been solidified over the past 12 months. Read the rest of this entry »